# Save packages as a vector
all.lib<-c("tidyverse","ggplot2", "dplyr","tidyr","modelr")

# Load packages
lapply(all.lib,require,character.only=TRUE)Exploratory Data Analysis
Setup
Introduction:
Steps to exploratory data analysis:
- Generate questions and hypothesis about the data.
- Understand your data
- Read the metadata if the data is not yours
- Think about the analysis plan led by questions
- Make sure your hypothesis-driven studies are clearly stated
Load your data: Example 1
a. Fuel economy data from 1999 to 2008 for 38 popular models of cars. The subset dataset from EPA. Full data available [here](https://fueleconomy.gov). A dataframe with 234 rows and 11 variables:
| Variable | |
|---|---|
| manufacturer | manufacturer name |
| model | model name |
| displ | engine displacement, in liters |
| year | year of manufacturer |
| cyl | number of cylinders |
| trans | type of transmission |
| drv | type of drive train, front wheel, rear wheel |
| cty | city miles per gallon |
| hwy | highway miles per gallon |
| fl | fuel type |
| class | “type” of car |
# Load data
data("mpg")
head(mpg)
# A tibble: 6 × 11
manufacturer model displ year cyl trans drv cty hwy fl class
<chr> <chr> <dbl> <int> <int> <chr> <chr> <int> <int> <chr> <chr>
1 audi a4 1.8 1999 4 auto(l5) f 18 29 p compa…
2 audi a4 1.8 1999 4 manual(m5) f 21 29 p compa…
3 audi a4 2 2008 4 manual(m6) f 20 31 p compa…
4 audi a4 2 2008 4 auto(av) f 21 30 p compa…
5 audi a4 2.8 1999 6 auto(l5) f 16 26 p compa…
6 audi a4 2.8 1999 6 manual(m5) f 18 26 p compa…Exploring the data
# Useful functions in exploring the data
tail(mpg)
# A tibble: 6 × 11
manufacturer model displ year cyl trans drv cty hwy fl class
<chr> <chr> <dbl> <int> <int> <chr> <chr> <int> <int> <chr> <chr>
1 volkswagen passat 1.8 1999 4 auto(l5) f 18 29 p mids…
2 volkswagen passat 2 2008 4 auto(s6) f 19 28 p mids…
3 volkswagen passat 2 2008 4 manual(m6) f 21 29 p mids…
4 volkswagen passat 2.8 1999 6 auto(l5) f 16 26 p mids…
5 volkswagen passat 2.8 1999 6 manual(m5) f 18 26 p mids…
6 volkswagen passat 3.6 2008 6 auto(s6) f 17 26 p mids…ncol(mpg)[1] 11nrow(mpg)[1] 234dim(mpg)[1] 234 11str(mpg)tibble [234 × 11] (S3: tbl_df/tbl/data.frame)
$ manufacturer: chr [1:234] "audi" "audi" "audi" "audi" ...
$ model : chr [1:234] "a4" "a4" "a4" "a4" ...
$ displ : num [1:234] 1.8 1.8 2 2 2.8 2.8 3.1 1.8 1.8 2 ...
$ year : int [1:234] 1999 1999 2008 2008 1999 1999 2008 1999 1999 2008 ...
$ cyl : int [1:234] 4 4 4 4 6 6 6 4 4 4 ...
$ trans : chr [1:234] "auto(l5)" "manual(m5)" "manual(m6)" "auto(av)" ...
$ drv : chr [1:234] "f" "f" "f" "f" ...
$ cty : int [1:234] 18 21 20 21 16 18 18 18 16 20 ...
$ hwy : int [1:234] 29 29 31 30 26 26 27 26 25 28 ...
$ fl : chr [1:234] "p" "p" "p" "p" ...
$ class : chr [1:234] "compact" "compact" "compact" "compact" ...summary(mpg) manufacturer model displ year
Length:234 Length:234 Min. :1.600 Min. :1999
Class :character Class :character 1st Qu.:2.400 1st Qu.:1999
Mode :character Mode :character Median :3.300 Median :2004
Mean :3.472 Mean :2004
3rd Qu.:4.600 3rd Qu.:2008
Max. :7.000 Max. :2008
cyl trans drv cty
Min. :4.000 Length:234 Length:234 Min. : 9.00
1st Qu.:4.000 Class :character Class :character 1st Qu.:14.00
Median :6.000 Mode :character Mode :character Median :17.00
Mean :5.889 Mean :16.86
3rd Qu.:8.000 3rd Qu.:19.00
Max. :8.000 Max. :35.00
hwy fl class
Min. :12.00 Length:234 Length:234
1st Qu.:18.00 Class :character Class :character
Median :24.00 Mode :character Mode :character
Mean :23.44
3rd Qu.:27.00
Max. :44.00 Creating a tibble
data <- data.frame(a = 1:3, b = letters[1:3], c = Sys.Date() - 1:3)

data
a b c
1 1 a 2025-07-16
2 2 b 2025-07-15
3 3 c 2025-07-14#> a b c
#> 1 1 a 2023-02-21
#> 2 2 b 2023-02-20
#> 3 3 c 2023-02-19
as_tibble(data)# A tibble: 3 × 3
a b c
<int> <chr> <date>
1 1 a 2025-07-16
2 2 b 2025-07-15
3 3 c 2025-07-14#> # A tibble: 3 × 3
#> a b c
#> <int> <chr> <date>
#> 1 1 a 2023-02-21
#> 2 2 b 2023-02-20
#> 3 3 c 2023-02-19
## Creating a tibble from preloaded dataset
data(iris)
head(iris) Sepal.Length Sepal.Width Petal.Length Petal.Width Species
1 5.1 3.5 1.4 0.2 setosa
2 4.9 3.0 1.4 0.2 setosa
3 4.7 3.2 1.3 0.2 setosa
4 4.6 3.1 1.5 0.2 setosa
5 5.0 3.6 1.4 0.2 setosa
6 5.4 3.9 1.7 0.4 setosaas_tibble(iris)# A tibble: 150 × 5
Sepal.Length Sepal.Width Petal.Length Petal.Width Species
<dbl> <dbl> <dbl> <dbl> <fct>
1 5.1 3.5 1.4 0.2 setosa
2 4.9 3 1.4 0.2 setosa
3 4.7 3.2 1.3 0.2 setosa
4 4.6 3.1 1.5 0.2 setosa
5 5 3.6 1.4 0.2 setosa
6 5.4 3.9 1.7 0.4 setosa
7 4.6 3.4 1.4 0.3 setosa
8 5 3.4 1.5 0.2 setosa
9 4.4 2.9 1.4 0.2 setosa
10 4.9 3.1 1.5 0.1 setosa
# ℹ 140 more rows# Saving the tibble a new dataset
iris.updated<-as_tibble(iris)1. Finding patterns in data through visualization and transformations
Categorical variable
Using geom_bar for displaying categorical variable,
ggplot(data = mpg) +
  geom_bar(mapping = aes(x = manufacturer))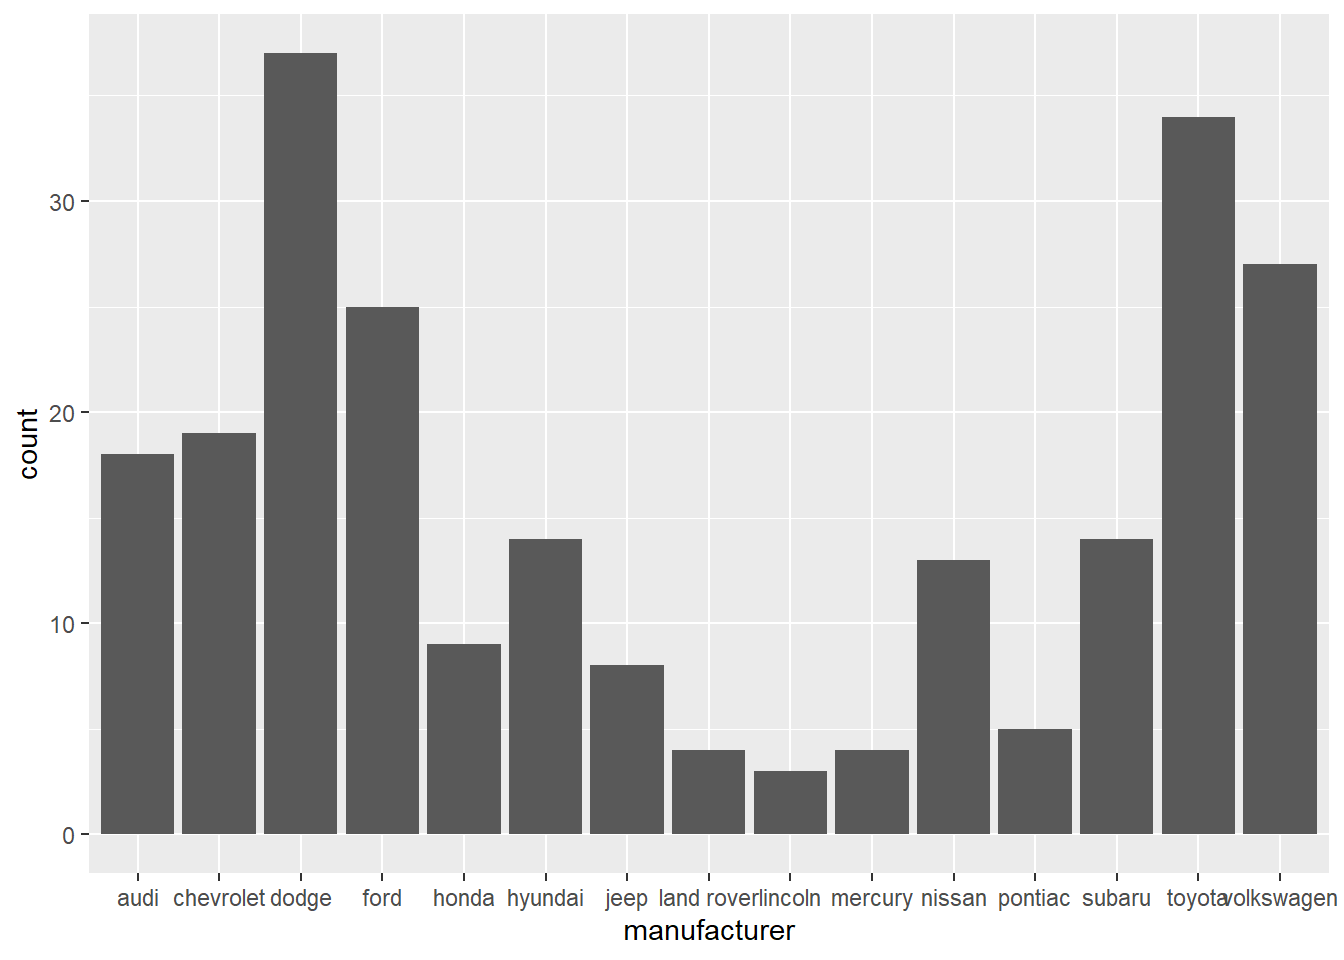
Using the same above example for iris dataset, using the categorical variable,
ggplot(data = iris) +
  geom_bar(mapping = aes(x = Species))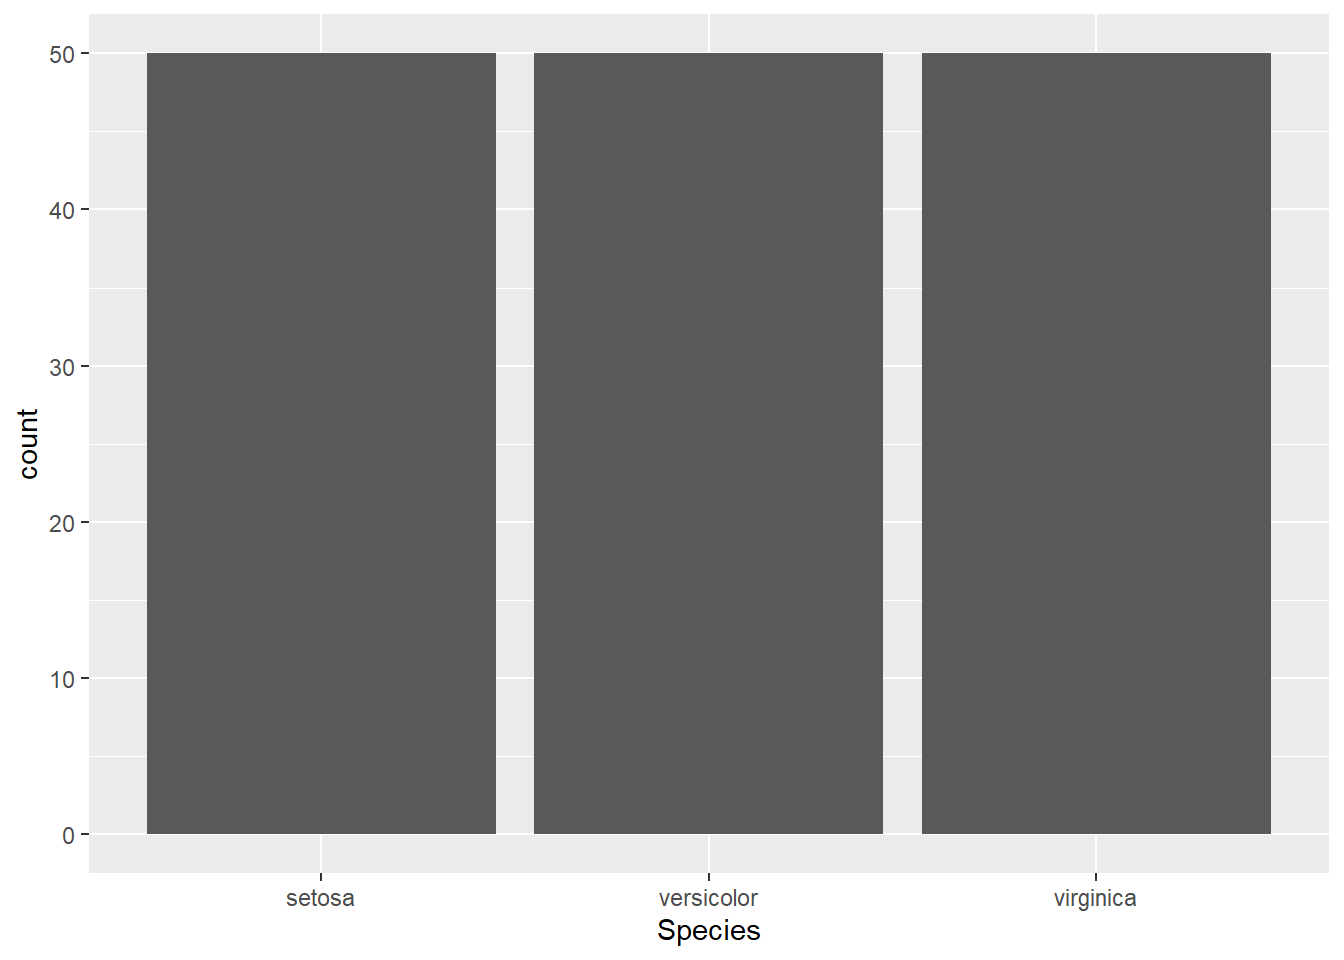
Notice how the bars are equal because the y axis that shows the count is same (i.e 50) for each of the species.
Count function
The height of the bars displays how many observations occurred with each x value.
mpg %>%
  count(manufacturer)
# A tibble: 15 × 2
manufacturer n
<chr> <int>
1 audi 18
2 chevrolet 19
3 dodge 37
4 ford 25
5 honda 9
6 hyundai 14
7 jeep 8
8 land rover 4
9 lincoln 3
10 mercury 4
11 nissan 13
12 pontiac 5
13 subaru 14
14 toyota 34
15 volkswagen 27Continuous variable
Using geom_bar for a continuous variable,
Note: geom_bar() makes the height of the bar proportional to the number of cases in each group
mpg %>%
 ggplot()+
 geom_bar(mapping = aes(x = displ), binwidth = 0.5)
Warning in geom_bar(mapping = aes(x = displ), binwidth = 0.5): Ignoring unknown
parameters: `binwidth`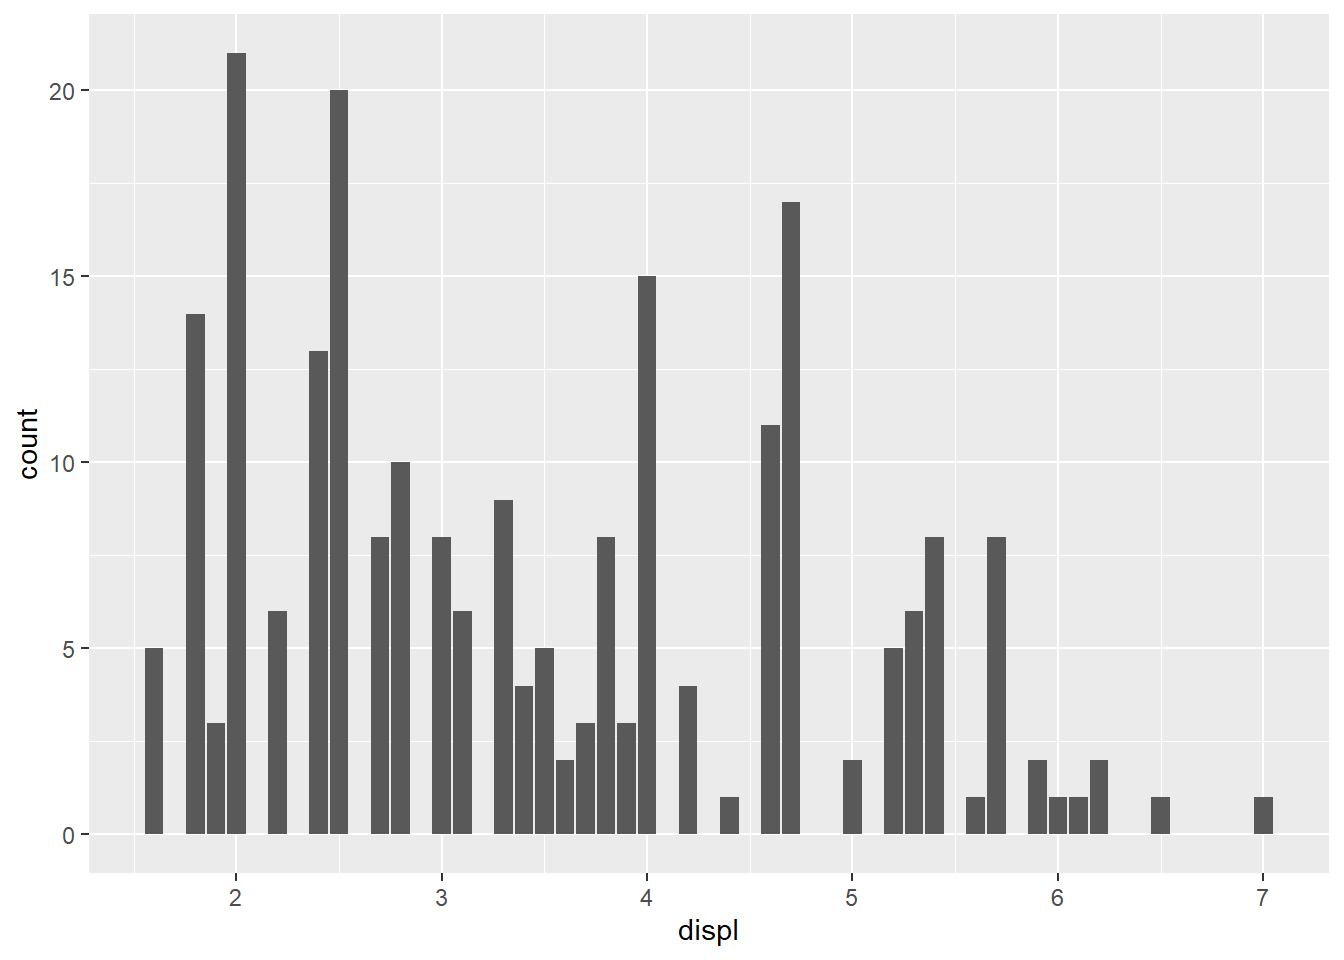
Using histogram for continuous variable,
mpg %>%
 ggplot()+
 geom_histogram(mapping = aes(x = displ), binwidth = 0.5)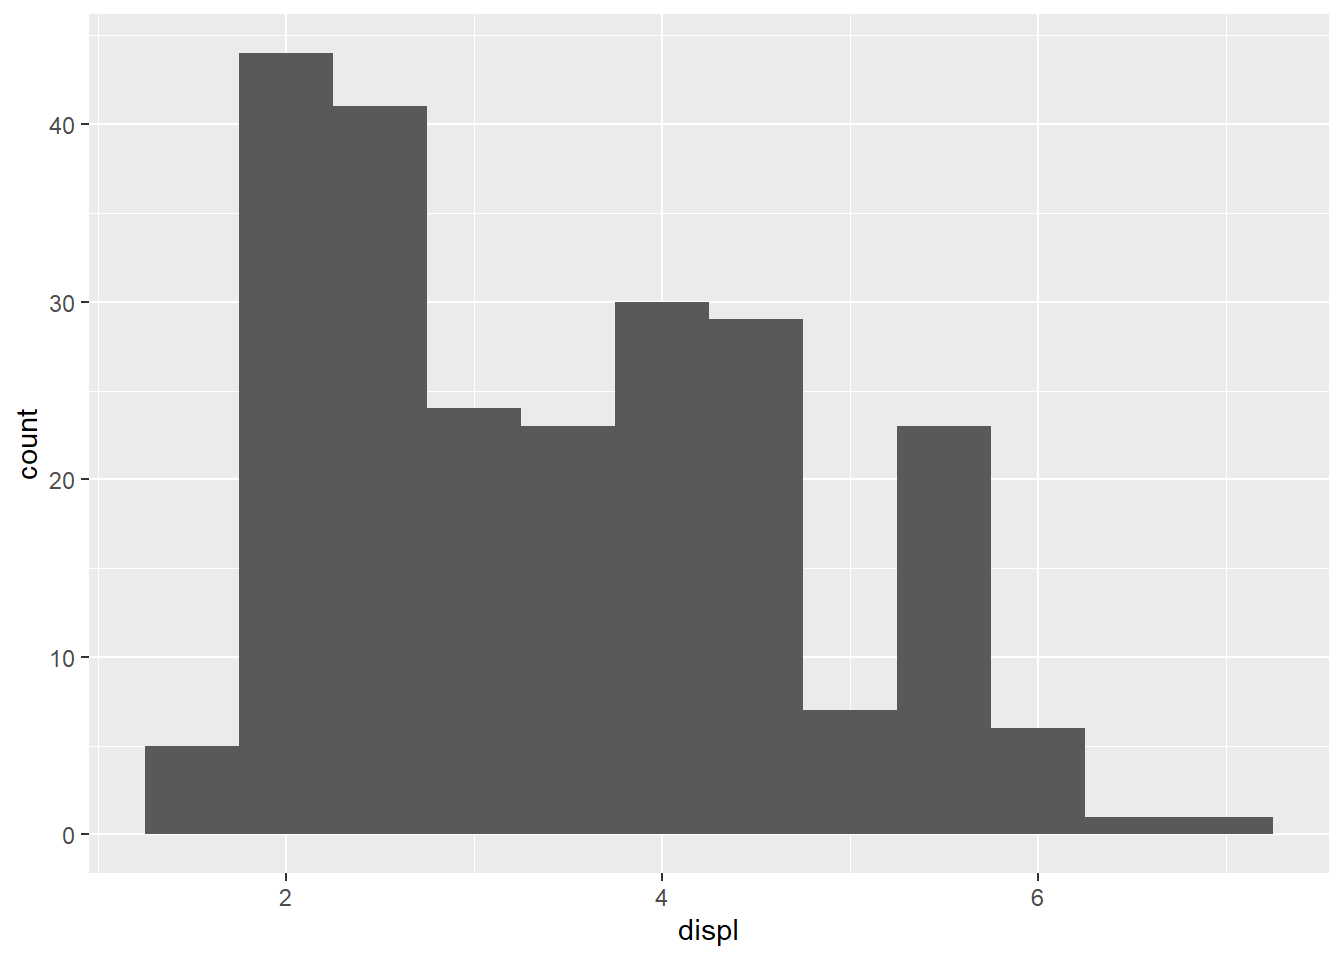
cut_width function
Display how the histogram was made
For mpg dataset,
mpg %>%
count(cut_width(displ, 0.5))
# A tibble: 12 × 2
`cut_width(displ, 0.5)` n
<fct> <int>
1 [1.25,1.75] 5
2 (1.75,2.25] 44
3 (2.25,2.75] 41
4 (2.75,3.25] 24
5 (3.25,3.75] 23
6 (3.75,4.25] 30
7 (4.25,4.75] 29
8 (4.75,5.25] 7
9 (5.25,5.75] 23
10 (5.75,6.25] 6
11 (6.25,6.75] 1
12 (6.75,7.25] 1- Note here that the numbers correspond to the binwidth used in each histogram
Filter function
smaller dataset by filtering. The filter function evaluates a condition inside the bracket.
mpg %>%
  filter(cty >20)
# A tibble: 45 × 11
manufacturer model displ year cyl trans drv cty hwy fl class
<chr> <chr> <dbl> <int> <int> <chr> <chr> <int> <int> <chr> <chr>
1 audi a4 1.8 1999 4 manual(m… f 21 29 p comp…
2 audi a4 2 2008 4 auto(av) f 21 30 p comp…
3 chevrolet malibu 2.4 2008 4 auto(l4) f 22 30 r mids…
4 honda civic 1.6 1999 4 manual(m… f 28 33 r subc…
5 honda civic 1.6 1999 4 auto(l4) f 24 32 r subc…
6 honda civic 1.6 1999 4 manual(m… f 25 32 r subc…
7 honda civic 1.6 1999 4 manual(m… f 23 29 p subc…
8 honda civic 1.6 1999 4 auto(l4) f 24 32 r subc…
9 honda civic 1.8 2008 4 manual(m… f 26 34 r subc…
10 honda civic 1.8 2008 4 auto(l5) f 25 36 r subc…
# ℹ 35 more rowsmpg.sub<- mpg %>%
filter(cty >20)Plotting a subset of the dataset,
# plotting
ggplot(data = mpg.sub, mapping = aes(x = cty)) +
  geom_histogram(binwidth = 0.25)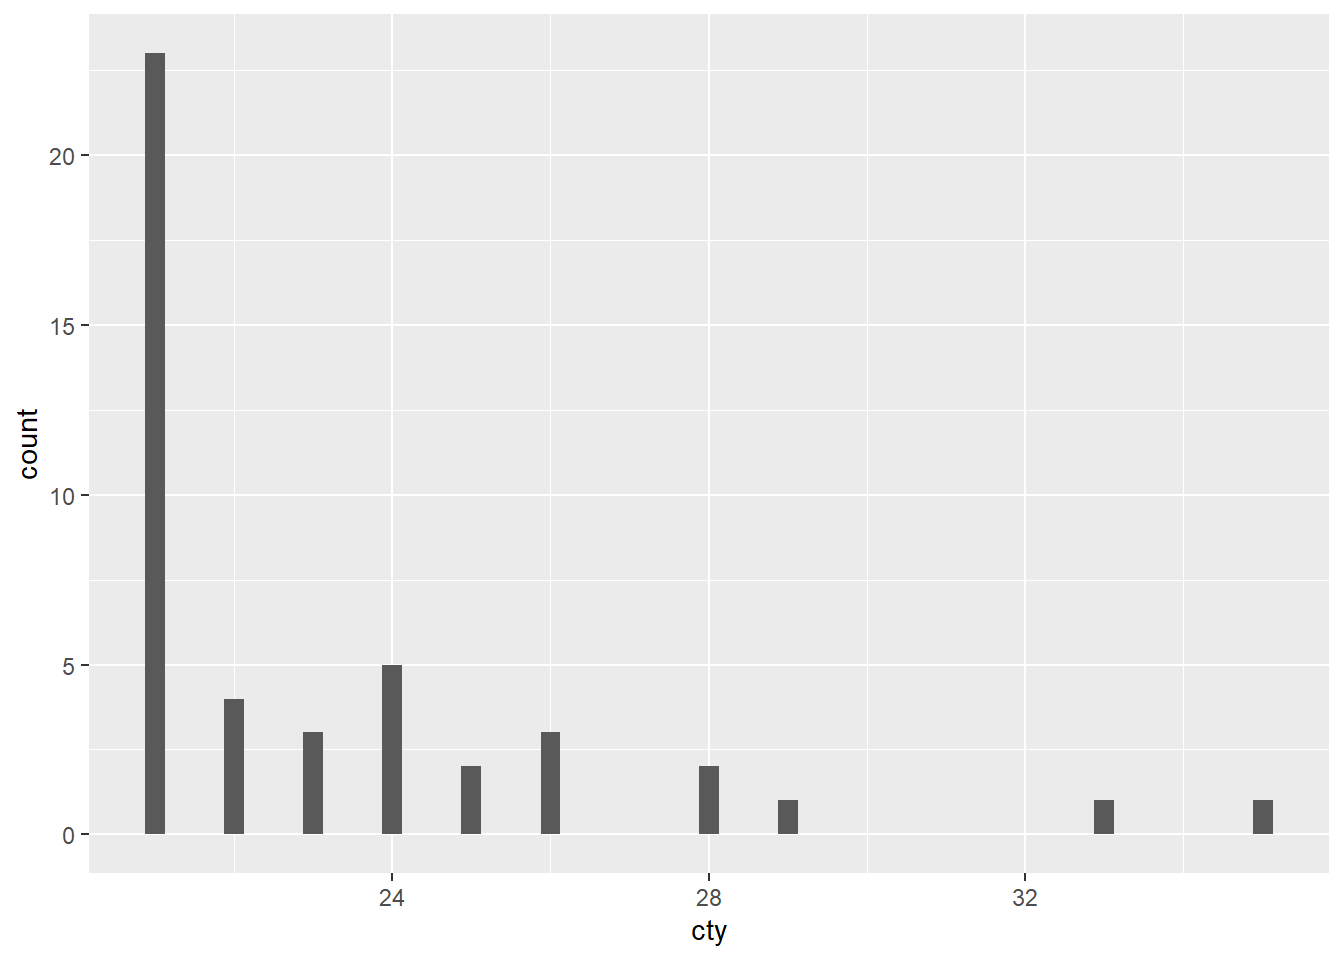
Expanding the x-y limits
# Seeing unusual values
ggplot(mpg) +
  geom_histogram(mapping = aes(x = displ), binwidth = 0.5)+
  coord_cartesian(ylim = c(0, 50), xlim=c(0,100))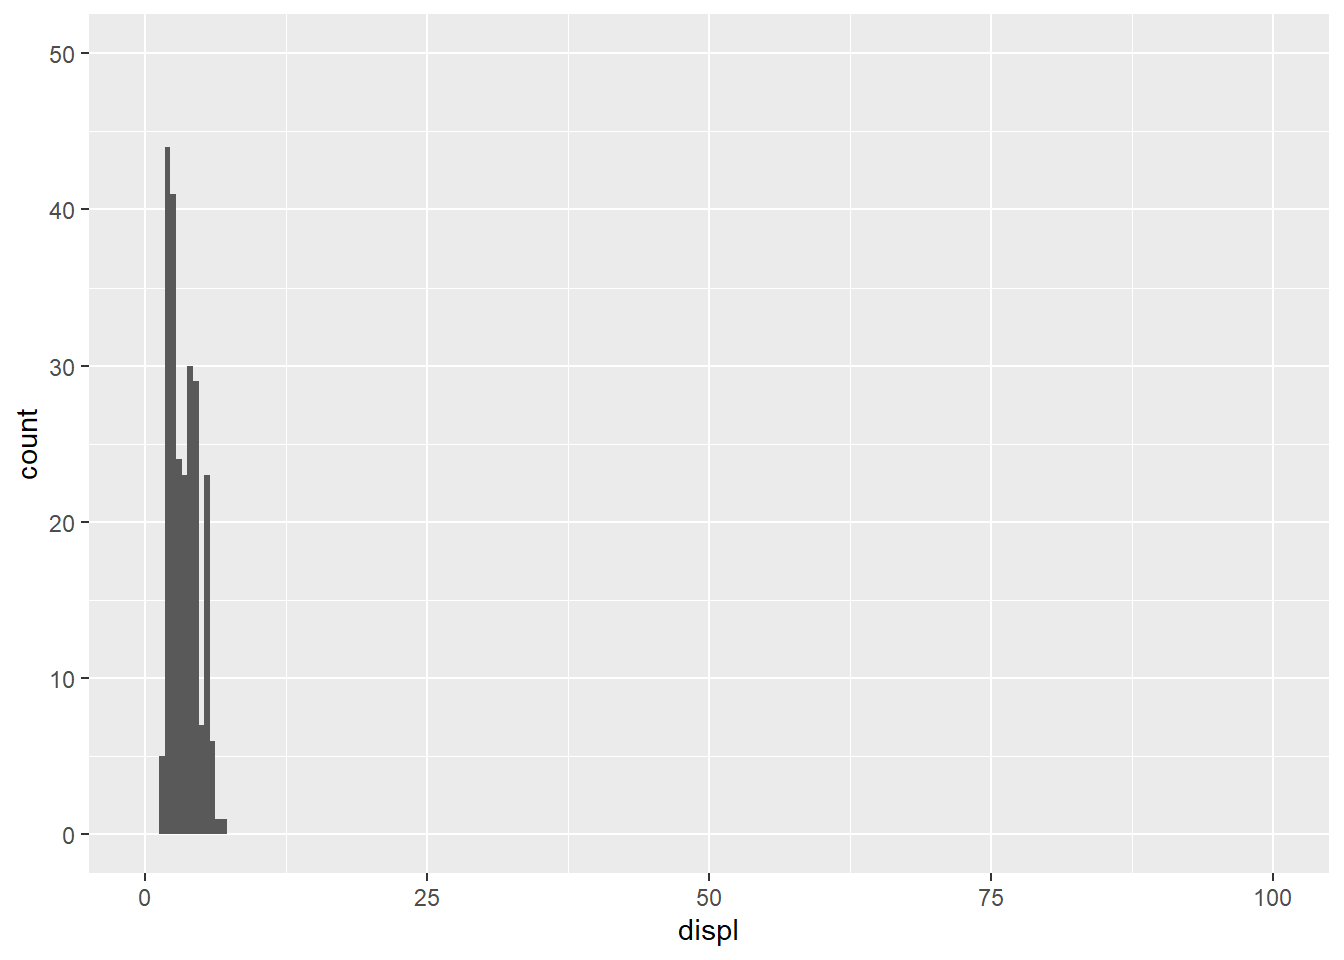
Select function
Used for subsetting a dataset, by selecting column names,
mpg.filtered1 <- mpg %>%
  filter(cty < 10 | cty > 15) %>%
  select(manufacturer,cty, displ)

mpg.filtered1
# A tibble: 142 × 3
manufacturer cty displ
<chr> <int> <dbl>
1 audi 18 1.8
2 audi 21 1.8
3 audi 20 2
4 audi 21 2
5 audi 16 2.8
6 audi 18 2.8
7 audi 18 3.1
8 audi 18 1.8
9 audi 16 1.8
10 audi 20 2
# ℹ 132 more rowsArrange function
Sorts in ascending order by the column name provided,
mpg.filtered2.asc <- mpg %>%
  filter(cty < 10 | cty > 15) %>%
  select(manufacturer,cty, displ) %>%
  arrange(cty)

mpg.filtered2.asc
# A tibble: 142 × 3
manufacturer cty displ
<chr> <int> <dbl>
1 dodge 9 4.7
2 dodge 9 4.7
3 dodge 9 4.7
4 dodge 9 4.7
5 jeep 9 4.7
6 audi 16 2.8
7 audi 16 1.8
8 audi 16 4.2
9 chevrolet 16 5.7
10 chevrolet 16 6.2
# ℹ 132 more rowsUsing arrange to sort in descending order, use the function across within arrange.
Note remember you can nest the functions within another function.
mpg.filtered2.dsc <- mpg %>%
  filter(cty < 10 | cty > 15) %>%
  select(manufacturer,cty, displ) %>%
  arrange(across(cty,desc))

mpg.filtered2.dsc
# A tibble: 142 × 3 manufacturer cty displ <chr> <int> <dbl> 1 volkswagen 35 1.9 2 volkswagen 33 1.9 3 volkswagen 29 1.9 4 honda 28 1.6 5 toyota 28 1.8 6 honda 26 1.8 7 toyota 26 1.8 8 toyota 26 1.8 9 honda 25 1.6 10 honda 25 1.8 # ℹ 132 more rows
Mutate function
Used for adding more columns using a condition. Note here that the notation for
ifelse(CONDITION, VALUE_IF_TRUE, VALUE_IF_FALSE)# Mutate - add more columns
mpg.filtered3 <- mpg.filtered2.asc %>%
mutate(newcol = ifelse(cty < 10, NA, 0))
mpg.filtered3# A tibble: 142 × 4
manufacturer cty displ newcol
<chr> <int> <dbl> <dbl>
1 dodge 9 4.7 NA
2 dodge 9 4.7 NA
3 dodge 9 4.7 NA
4 dodge 9 4.7 NA
5 jeep 9 4.7 NA
6 audi 16 2.8 0
7 audi 16 1.8 0
8 audi 16 4.2 0
9 chevrolet 16 5.7 0
10 chevrolet 16 6.2 0
# ℹ 132 more rowsYou can add multiple columns using mutate function,
mpg.filtered3 <- mpg.filtered2.asc %>%
  mutate(newcol = ifelse(cty < 10, NA, 0),
         anotherone= cty*5,
         randomcol="weird")

mpg.filtered3
# A tibble: 142 × 6
manufacturer cty displ newcol anotherone randomcol
<chr> <int> <dbl> <dbl> <dbl> <chr>
1 dodge 9 4.7 NA 45 weird
2 dodge 9 4.7 NA 45 weird
3 dodge 9 4.7 NA 45 weird
4 dodge 9 4.7 NA 45 weird
5 jeep 9 4.7 NA 45 weird
6 audi 16 2.8 0 80 weird
7 audi 16 1.8 0 80 weird
8 audi 16 4.2 0 80 weird
9 chevrolet 16 5.7 0 80 weird
10 chevrolet 16 6.2 0 80 weird
# ℹ 132 more rowsBoxplot
Using function geom_boxplot to look at trends in data,
# Boxplot
ggplot(data = mpg, mapping = aes(x = manufacturer, y = hwy)) +
  geom_boxplot()+
  xlab("highway miles")+
  ylab("manufacturer")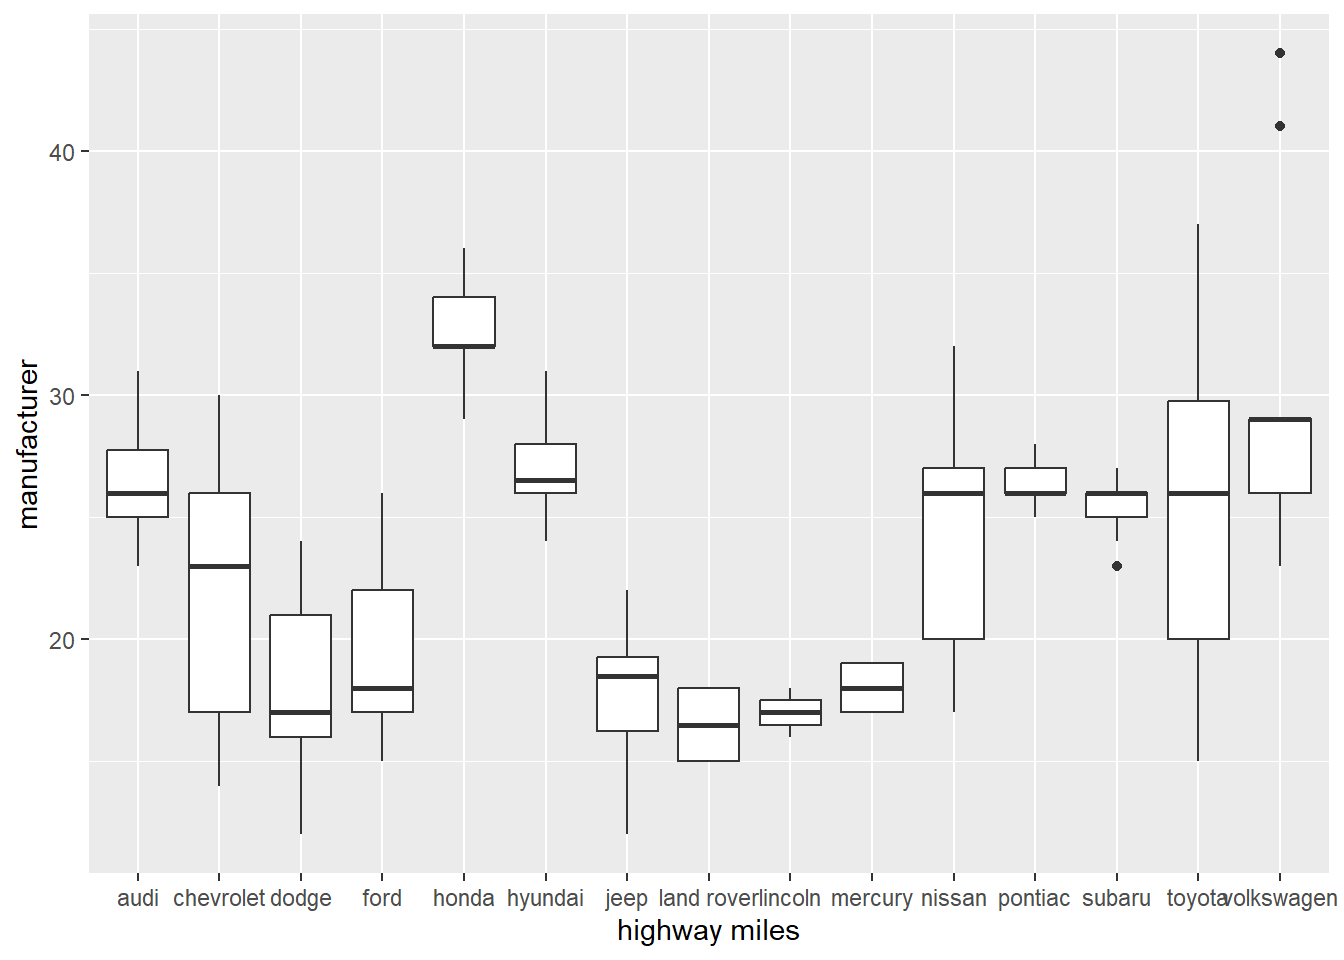
Reorder function
- Using function reorder to see a clear trend.
- Note that reorder is a special case of the function factor.
- The factor function is in base R and is used for ordering vector data.
# Easy to see trend
ggplot(data = mpg) +
  geom_boxplot(mapping = aes(x = reorder(manufacturer, hwy, FUN = median), y = hwy))+
  xlab("highway miles")+
  ylab("manufacturer")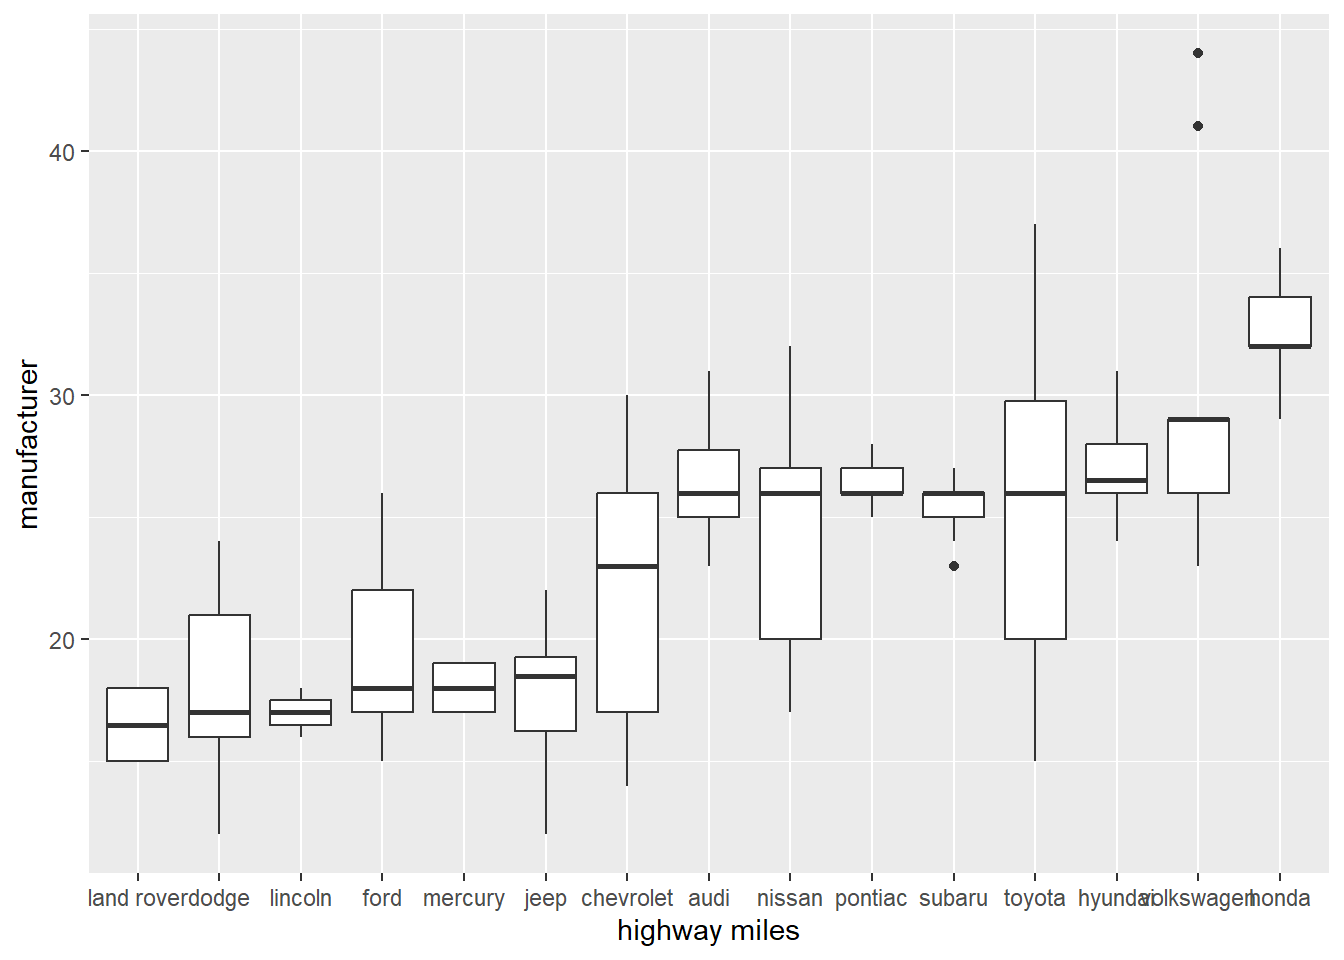
Flip the coordinates
# Flip coordinates
ggplot(data = mpg) +
  geom_boxplot(mapping = aes(x = reorder(manufacturer, hwy, FUN = median), y = hwy))+
  coord_flip()+
  xlab("highway miles")+
  ylab("manufacturer")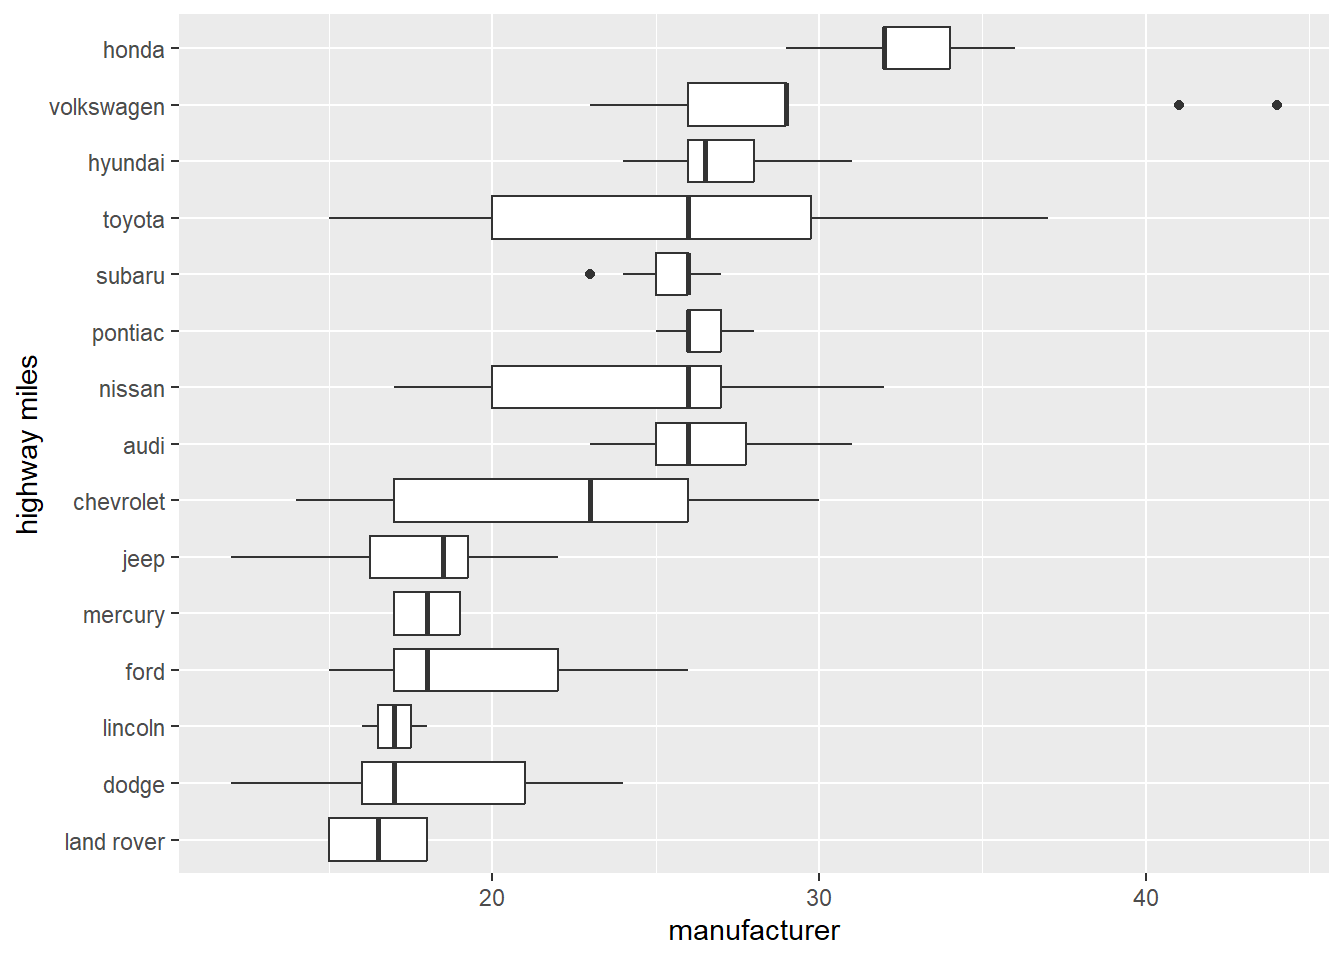
Scatterplot of the data
Geom point is used for looking at a scatterplot,
# Scatterplot
ggplot(data = mpg) +
  geom_point(mapping = aes(x = manufacturer, y = hwy))+
   xlab("highway miles")+
   ylab("manufacturer")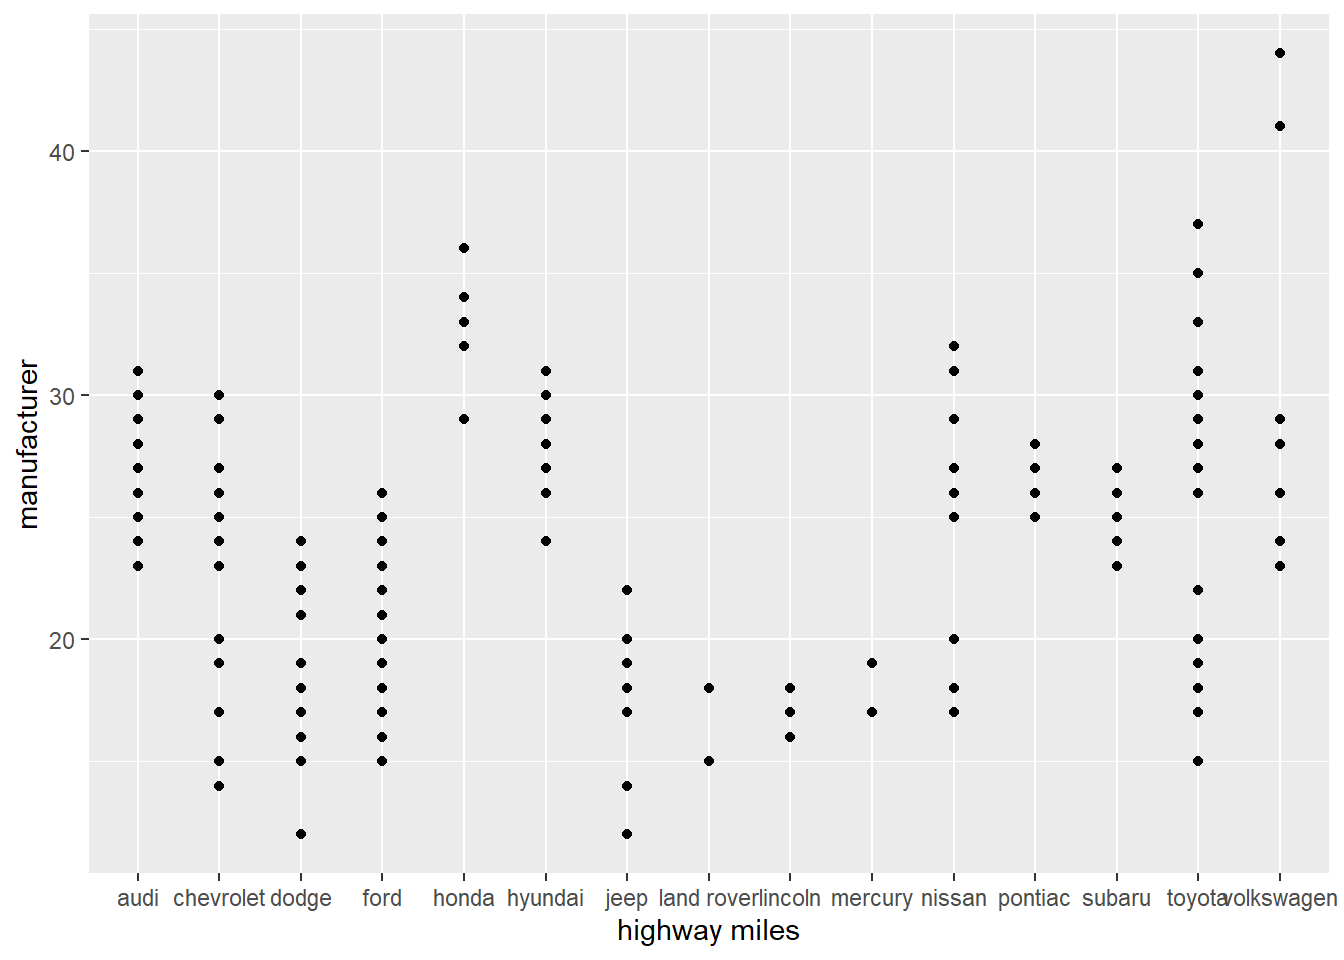
Finding patterns in data through modelling
Refine the questions based on what you learn and repeat the process. Let’s ask a new question.
How highway miles are varying with city miles?
# How highway miles are varying with city miles
ggplot(data = mpg)+
  geom_point(mapping = aes(x = hwy,y=cty))+
   xlab("highway miles")+
   ylab("city miles")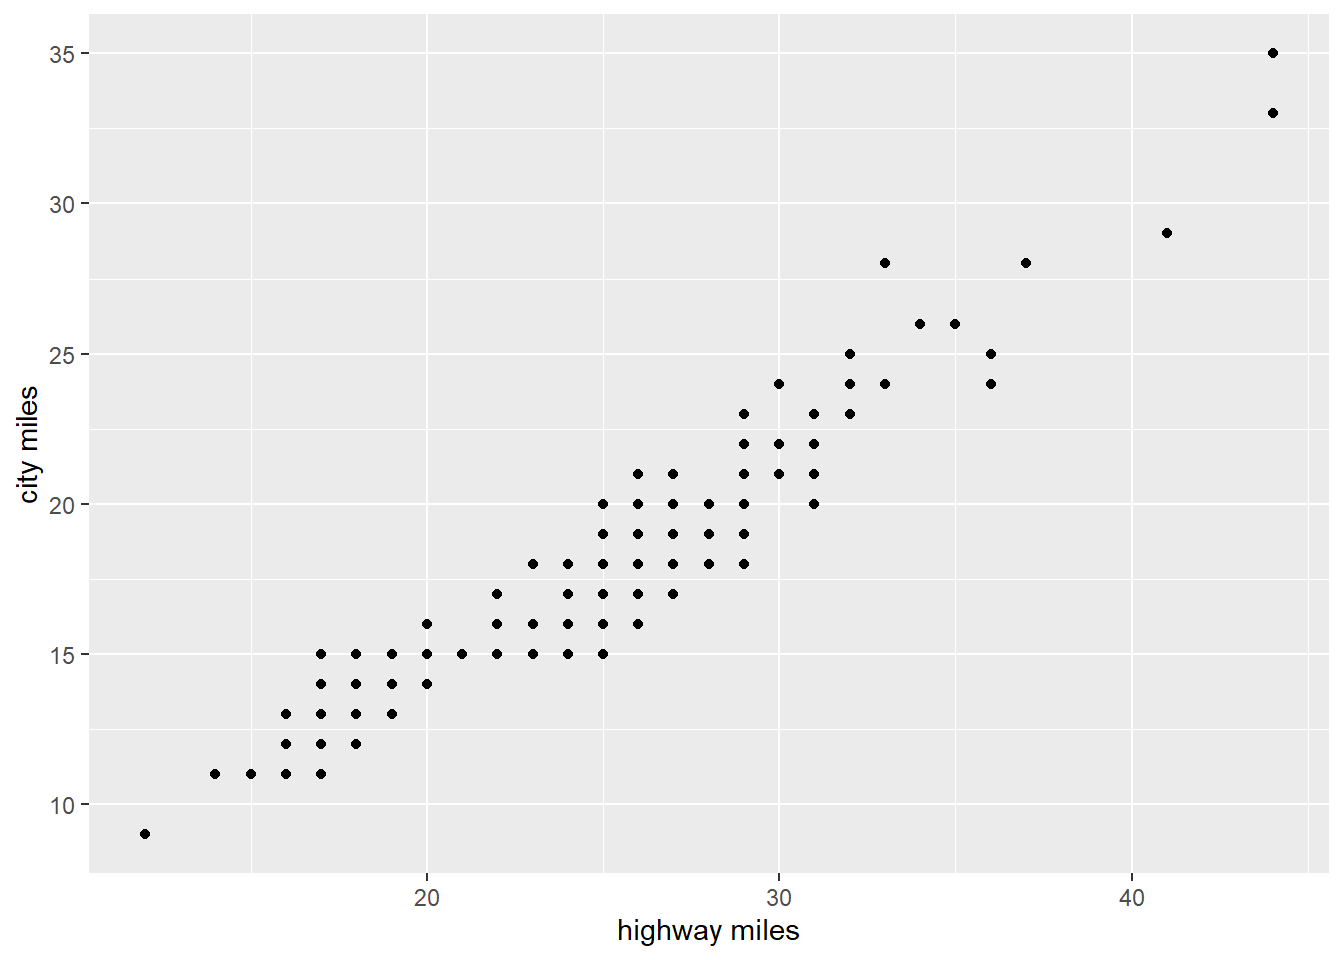
Linear regression
Are highway miles linearly related with city miles?
Defining a linear model
lm(hwy~cty,data = mpg)
Call:
lm(formula = hwy ~ cty, data = mpg)

Coefficients:
(Intercept)          cty
0.892 1.337 model1<-lm(hwy~cty,data = mpg)
summary(model1)
Call:
lm(formula = hwy ~ cty, data = mpg)

Residuals:
    Min      1Q  Median      3Q     Max
-5.3408 -1.2790  0.0214  1.0338  4.0461

Coefficients:
            Estimate Std. Error t value Pr(>|t|)
(Intercept)  0.89204    0.46895   1.902   0.0584 .
cty          1.33746    0.02697  49.585   <2e-16 ***
---
Signif. codes:  0 '***' 0.001 '**' 0.01 '*' 0.05 '.' 0.1 ' ' 1

Residual standard error: 1.752 on 232 degrees of freedom
Multiple R-squared:  0.9138,    Adjusted R-squared:  0.9134
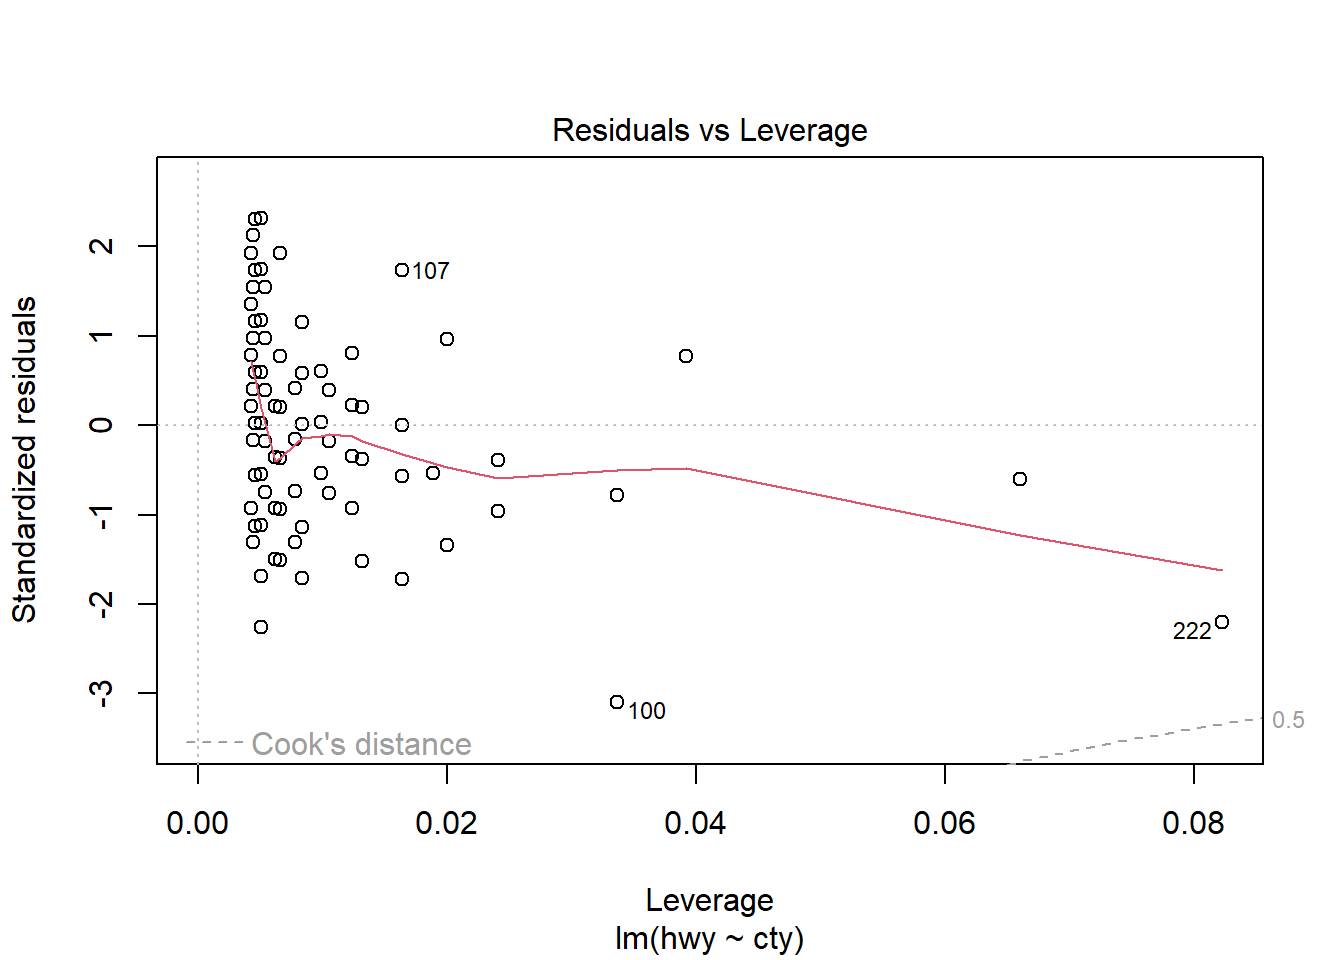
F-statistic: 2459 on 1 and 232 DF, p-value: < 2.2e-16plot(model1)


# Other useful functions
coefficients(model1) # model coefficients
(Intercept) cty
0.8920411 1.3374556 confint(model1, level=0.95) # Confidence Intervals for model parameters 2.5 % 97.5 %
(Intercept) -0.03189534 1.815978
cty 1.28431197 1.390599residuals(model1) # residuals values 1 2 3 4 5 6
4.033757915 0.021391084 3.358846694 1.021391084 3.708669135 1.033757915
7 8 9 10 11 12
2.033757915 1.033757915 2.708669135 0.358846694 0.696302304 4.046124746
13 14 15 16 17 18
1.371213525 1.371213525 4.046124746 3.046124746 1.371213525 0.708669135
19 20 21 22 23 24
0.383580356 -0.604052813 0.383580356 -1.278964034 0.058491577 3.708669135
25 26 27 28 29 30
2.046124746 3.708669135 4.046124746 3.046124746 -0.616419644 -1.604052813
31 32 33 34 35 36
-0.604052813 -2.616419644 0.696302304 -0.316064527 1.033757915 4.033757915
37 38 39 40 41 42
2.371213525 -0.966242085 0.371213525 -0.291330865 -0.291330865 0.371213525
43 44 45 46 47 48
0.371213525 1.395947187 1.046124746 0.046124746 0.708669135 0.708669135
49 50 51 52 53 54
-1.953875254 -1.616419644 -1.278964034 -2.616419644 -0.616419644 -0.616419644
55 56 57 58 59 60
-0.929141592 1.395947187 -0.604052813 -1.278964034 -1.278964034 -0.929141592
61 62 63 64 65 66
-1.278964034 0.395947187 -0.278964034 -0.604052813 -0.941508423 -0.929141592
67 68 69 70 71 72
-1.278964034 -1.278964034 -0.941508423 -0.929141592 -0.604052813 0.395947187
73 74 75 76 77 78
-1.278964034 -0.604052813 1.395947187 1.395947187 1.058491577 -2.616419644
79 80 81 82 83 84
-1.953875254 -2.616419644 0.721035966 0.721035966 -1.278964034 -2.616419644
85 86 87 88 89 90
-2.616419644 -2.278964034 -2.278964034 -1.278964034 -0.604052813 -1.278964034
91 92 93 94 95 96
1.033757915 0.033757915 2.371213525 1.708669135 0.046124746 1.046124746
97 98 99 100 101 102
2.046124746 1.046124746 0.383580356 -5.340798189 -0.990975747 -2.328431358
103 104 105 106 107 108
-2.653520137 -0.990975747 -1.665886968 1.671568642 3.009024253 0.021391084
109 110 111 112 113 114
1.033757915 2.033757915 1.021391084 2.021391084 1.033757915 1.033757915
115 116 117 118 119 120
1.696302304 -0.303697696 2.696302304 0.358846694 -0.641153306 0.371213525
121 122 123 124 125 126
1.708669135 0.371213525 -1.628786475 -1.953875254 -0.953875254 -2.616419644
127 128 129 130 131 132
-0.929141592 -0.616419644 -0.278964034 -1.604052813 -0.604052813 1.058491577
133 134 135 136 137 138
1.058491577 -0.604052813 1.395947187 0.395947187 1.058491577 -2.616419644
139 140 141 142 143 144
0.721035966 0.721035966 -1.278964034 0.021391084 0.696302304 -0.653520137
145 146 147 148 149 150
0.346479863 0.696302304 -0.303697696 1.033757915 -1.303697696 -1.303697696
151 152 153 154 155 156
-2.616419644 -3.953875254 0.383580356 1.058491577 1.033757915 3.708669135
157 158 159 160 161 162
3.371213525 3.033757915 2.708669135 0.033757915 -0.966242085 -0.641153306
163 164 165 166 167 168
-1.303697696 -1.641153306 -1.966242085 -2.978608916 -0.303697696 -0.303697696
169 170 171 172 173 174
-0.303697696 -2.641153306 -0.641153306 -1.303697696 -0.641153306 -0.953875254
175 176 177 178 179 180
-2.291330865 -1.953875254 -3.953875254 -2.291330865 -2.616419644 0.021391084
181 182 183 184 185 186
-1.978608916 2.021391084 2.021391084 1.033757915 1.033757915 1.696302304
187 188 189 190 191 192
-1.978608916 0.021391084 2.021391084 0.683935473 1.033757915 1.033757915
193 194 195 196 197 198
2.033757915 -2.990975747 0.009024253 -0.665886968 -1.340798189 -0.665886968
199 200 201 202 203 204
-0.604052813 -0.278964034 -0.953875254 -2.291330865 -1.628786475 -3.953875254
205 206 207 208 209 210
-1.953875254 -2.953875254 -2.291330865 0.021391084 -0.303697696 0.021391084
211 212 213 214 215 216
-1.316064527 0.371213525 -1.028076240 0.021391084 -0.303697696 -1.316064527
217 218 219 220 221 222
0.021391084 0.021391084 0.021391084 0.708669135 0.371213525 -3.702987461
223 224 225 226 227 228
1.321746201 0.021391084 -0.303697696 0.358846694 1.358846694 0.021391084
229 230 231 232 233 234
4.033757915 1.696302304 0.021391084 3.708669135 1.033757915 2.371213525 plot(residuals(model1)) # residuals plots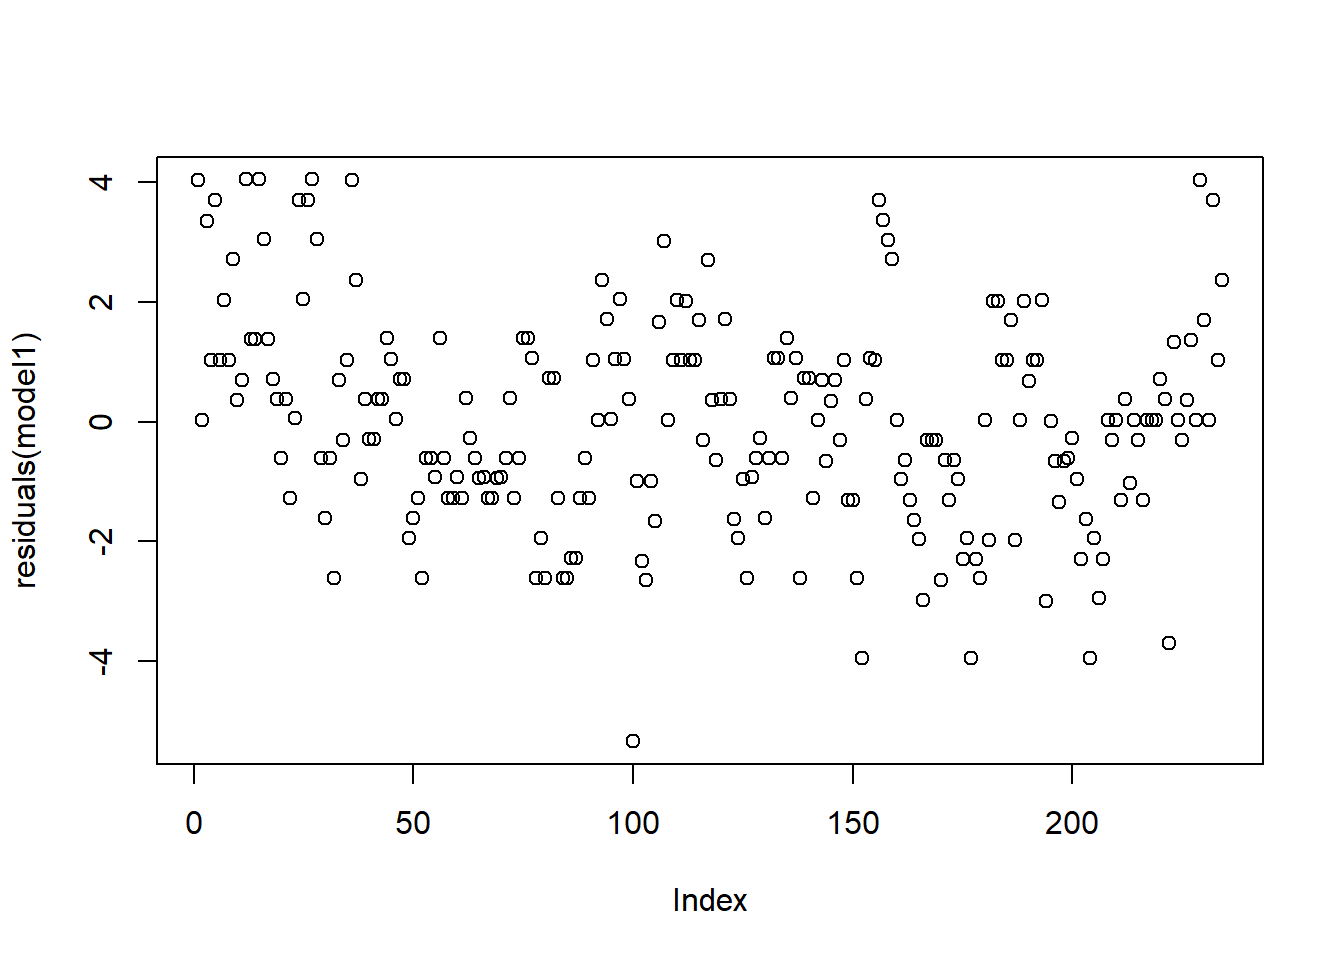
Using add_residual function within tidyverse
# Using ggplot2 and add_residual function
mpg.model1 <- mpg %>%
  add_residuals(model1) %>%
  mutate(resid = exp(resid))

ggplot(data = mpg.model1) +
  geom_point(mapping = aes(x = hwy, y = resid))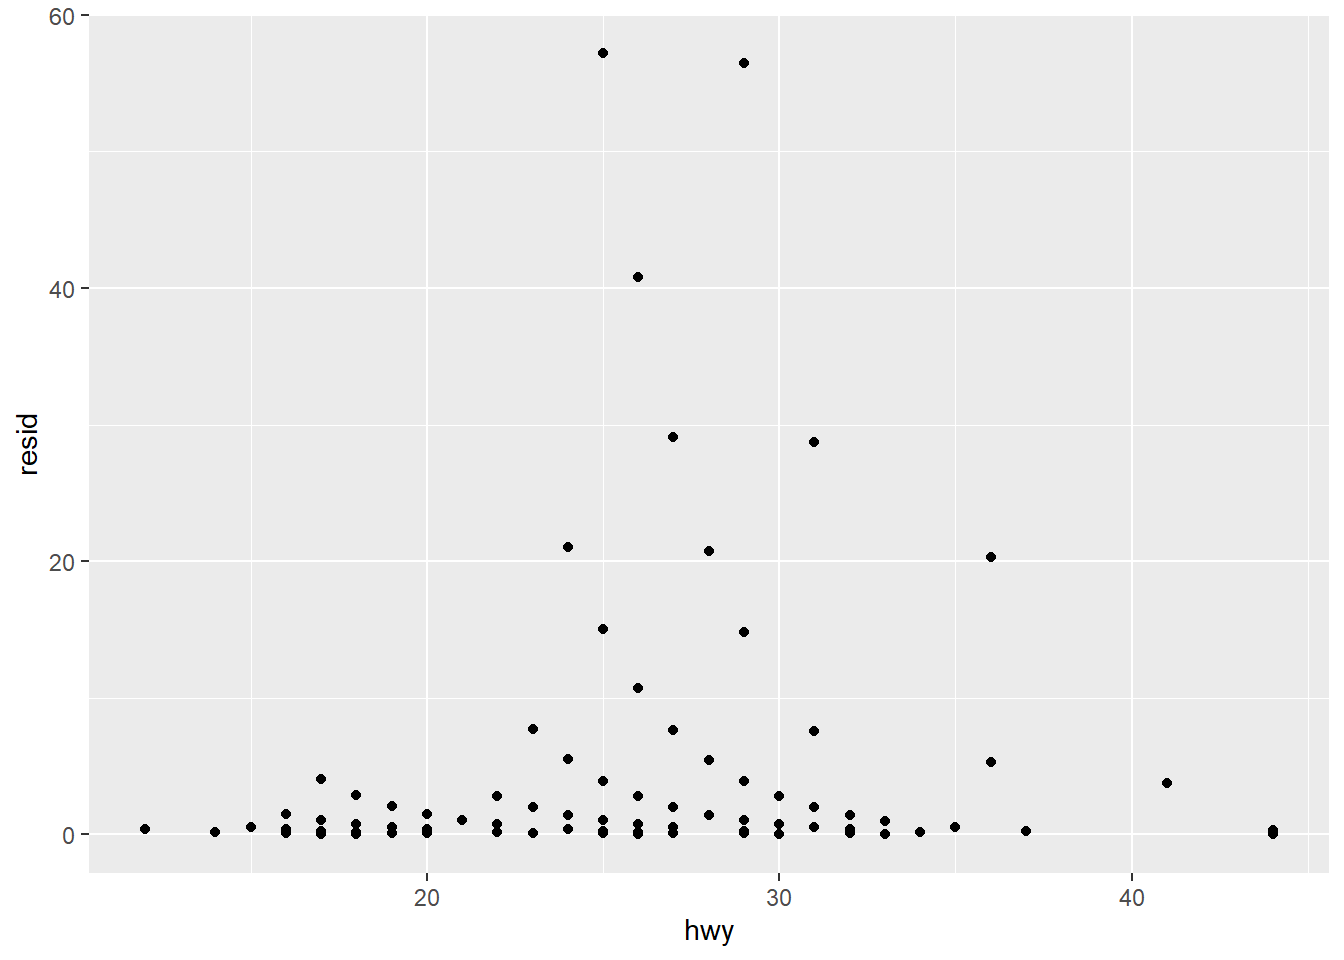
Is there a logarithmic relationship?
lm(log(hwy)~cty,data = mpg)
Call:
lm(formula = log(hwy) ~ cty, data = mpg)

Coefficients:
(Intercept)          cty
    2.16112      0.05697
Finding correlation
- cor() : computes the correlation coefficient
- cor.test() : test for association/correlation between paired samples. It returns both the correlation coefficient and the significance level(or p-value) of the correlation.
# Default method: Pearson
cor(mpg$cty, mpg$hwy)
[1] 0.9559159cor.test(mpg$cty, mpg$hwy, method="pearson")
    Pearson's product-moment correlation

data:  mpg$cty and mpg$hwy
t = 49.585, df = 232, p-value < 2.2e-16
alternative hypothesis: true correlation is not equal to 0
95 percent confidence interval:
 0.9433129 0.9657663
sample estimates:
      cor
0.9559159
# Save into a vector
cor.result<-cor.test(mpg$cty, mpg$hwy, method="pearson")- t is the t-test statistic value;
- df is the degrees of freedom;
- p-value is the significance level of the t-test;
- conf.int is the confidence interval of the correlation coefficient at 95%;
- sample estimates is the correlation coefficient(Cor.coeff)
# Extract the p.value
cor.result$p.value
[1] 1.868307e-125# Extract the correlation coefficient
cor.result$estimate cor
0.9559159 T-test
t.test(mpg$cty, mpg$hwy) # here both the variable are numeric
    Welch Two Sample t-test

data:  mpg$cty and mpg$hwy
t = -13.755, df = 421.79, p-value < 2.2e-16
alternative hypothesis: true difference in means is not equal to 0
95 percent confidence interval:
 -7.521683 -5.640710
sample estimates:
mean of x mean of y
 16.85897  23.44017
# paired t-test
t.test(mpg$cty,mpg$hwy,paired=TRUE) # both the variable are numeric
    Paired t-test

data:  mpg$cty and mpg$hwy
t = -44.492, df = 233, p-value < 2.2e-16
alternative hypothesis: true mean difference is not equal to 0
95 percent confidence interval:
 -6.872628 -6.289765
sample estimates:
mean difference
      -6.581197
You can use the var.equal = TRUE option to specify equal variances and a pooled variance estimate.
You can use the alternative=“less” or alternative=“greater” option to specify a one tailed test.
Simulated dataset using probability distribution
# Creating simulated data to work
set.seed(5)

xvar <- 1:20 + rnorm(20,sd=3)
zvar <- (1:20)/4 + rnorm(20,sd=2)
yvar <- -2*xvar + xvar*zvar/5 + 3 + rnorm(20,sd=4)

# Make a data frame
mydat <- data.frame(x=xvar, y=yvar, z=zvar)

# first 6 rows
head(mydat)
x y z
1 -1.5225664 11.620810 2.0510239
2 6.1530780 -9.582383 2.3837388
3 -0.7664756 3.669601 3.6859238
4 4.2104283 4.194208 2.4135222
5 10.1343226 -13.241300 2.8880179
6 4.1912761 -2.368301 0.9130363T-test
# independent 2-group t-test
#t.test(y~x) # where y is numeric and x is a binary factor

# independent 2-group t-test
t.test(yvar,xvar) # where y1 and y2 are numeric
    Welch Two Sample t-test

data:  yvar and xvar
t = -7.1706, df = 30.697, p-value = 4.899e-08
alternative hypothesis: true difference in means is not equal to 0
95 percent confidence interval:
 -23.70438 -13.20283
sample estimates:
mean of x mean of y
-8.795275  9.658327
# paired t-test
t.test(yvar,xvar,paired=TRUE) # where yvar,xvar are numeric
    Paired t-test

data:  yvar and xvar
t = -5.4883, df = 19, p-value = 2.703e-05
alternative hypothesis: true mean difference is not equal to 0
95 percent confidence interval:
 -25.49104 -11.41616
sample estimates:
mean difference
       -18.4536
Correlation
Pearson’s
# Correlation between xvar and yvar
# Default method: Pearson
cor(mydat$x, mydat$y)
[1] -0.8098878cor.test(mydat$x, mydat$y, method="pearson")
    Pearson's product-moment correlation

data:  mydat$x and mydat$y
t = -5.8577, df = 18, p-value = 1.51e-05
alternative hypothesis: true correlation is not equal to 0
95 percent confidence interval:
 -0.9219786 -0.5725725
sample estimates:
       cor
-0.8098878
# Save into a vector
cor.result<-cor.test(mydat$x, mydat$y, method="pearson")
# Extract the p.value
cor.result$p.value[1] 1.510141e-05# Extract the correlation coefficient
cor.result$estimate cor
-0.8098878 Spearman’s
# Spearman's correlation
cor(mydat$x, mydat$y, method="spearman")
[1] -0.7804511cor.test(mydat$x, mydat$y, method="spearman")
    Spearman's rank correlation rho

data:  mydat$x and mydat$y
S = 2368, p-value = 7.156e-05
alternative hypothesis: true rho is not equal to 0
sample estimates:
       rho
-0.7804511
Kendall’s
# Kendall's correlation
cor(mydat$x, mydat$y, method="kendall")
[1] -0.6210526cor.test(mydat$x, mydat$y, method="kendall")
    Kendall's rank correlation tau

data:  mydat$x and mydat$y
T = 36, p-value = 5.177e-05
alternative hypothesis: true tau is not equal to 0
sample estimates:
       tau
-0.6210526